

Chọn kỹ năng và bắt đầu luyện tập - chấm điểm tự động theo chuẩn band IELTS.
Chấm điểm bài viết theo band IELTS với phản hồi chi tiết.
Luyện đọc hiểu theo từng passage & full test.

Luyện nghe theo từng Part & full test, chấm tự động theo đáp án.

Luyện nói Part 1/2/3 — chấm AI ngay, hoặc đặt lịch với Examiner VUS.
910 đề luyện tập

The bar chart shows the percentage of adults who volunteered in five different sectors in a particular country in 2022, while the pie chart shows the overall breakdown of total volunteering hours cont
LUYỆN TẬP NGAYLine Graph
The graph below shows the average annual concentration of fine particulate matter (PM2.5, measured in micrograms per cubic metre) in the air of two contrasting regions - an industrialised northern zon
LUYỆN TẬP NGAYLine Graph
The graph below shows the percentage of the population living in urban areas in two contrasting regions - Northern Europe and Sub-Saharan Africa - between 1990 and 2015. Summarise the information by s
LUYỆN TẬP NGAYProcess
The diagram below shows the process by which a rural village is transformed into an urban district through planned urbanisation. Summarise the information by selecting and reporting the main features,
LUYỆN TẬP NGAYBar Chart
The chart below shows the percentage of adults participating in four selected community activities in urban and rural areas of a particular country in 2021, broken down by gender. Summarise the inform
LUYỆN TẬP NGAYListening
VUS IELTS Listening Test 212
LUYỆN TẬP NGAYart, design and architecture
Đề Reading: Colour in Architecture: A Changing Story
LUYỆN TẬP NGAYfood and agriculture
Đề Reading: Counting What We Cannot See: The Problem of Measuring Food Loss
LUYỆN TẬP NGAYBar Chart
The chart below shows the percentage of adults seeking treatment for four categories of chronic health condition, broken down by three healthcare sectors, in a national survey. Summarise the informati
LUYỆN TẬP NGAYListening
VUS IELTS Listening Test 234
LUYỆN TẬP NGAYTable
The table below shows the average annual expenditure per person (in USD) on five social services across four age groups in a European country in 2022. Summarise the information by selecting and report
LUYỆN TẬP NGAYLine Graph
The graph below shows the average number of volunteer hours per person per year in four countries - Germany, Brazil, South Korea, and Canada - between 2005 and 2030. Summarise the information by selec
LUYỆN TẬP NGAYsociety and culture
Đề Reading: Household Realities in the Age of the Nuclear Ideal
LUYỆN TẬP NGAYLine Graph
The graph below shows the average weekly time spent on outdoor environmental activities (such as conservation volunteering, nature walks, and wildlife monitoring) by people in three age groups in a Eu
LUYỆN TẬP NGAYListening
VUS IELTS Listening Test 156
LUYỆN TẬP NGAYPie Chart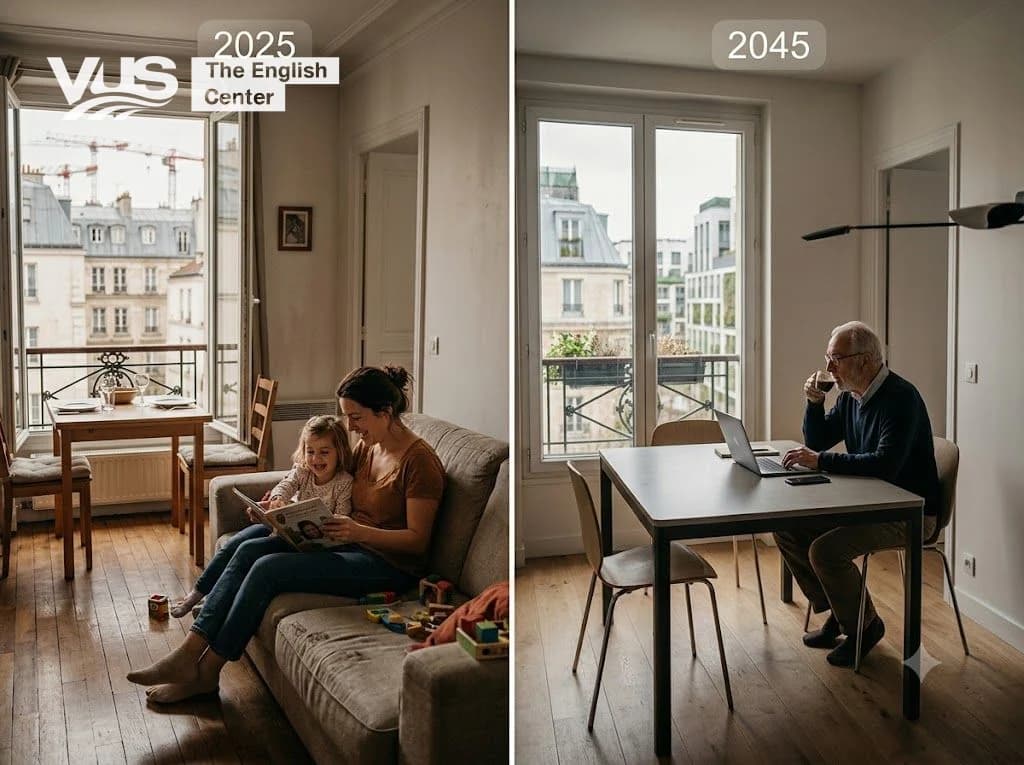
The two charts below show the projected distribution of household types in a European city in 2025 and 2045. Summarise the information by selecting and reporting the main features, and make comparison
LUYỆN TẬP NGAYPie Chart
The two pie charts below show the distribution of household spending categories among low-income families and high-income families in a European country in 2023. Summarise the information by selecting
LUYỆN TẬP NGAYcities and transport
Đề Reading: Counting the Invisible: How Researchers Measure Urban Traffic
LUYỆN TẬP NGAYhistory and archaeology
Đề Reading: The Shipwreck That Rewrote Roman Trade Routes
LUYỆN TẬP NGAYListening
VUS IELTS Listening Test 84
LUYỆN TẬP NGAY