

Chọn kỹ năng và bắt đầu luyện tập - chấm điểm tự động theo chuẩn band IELTS.
Chấm điểm bài viết theo band IELTS với phản hồi chi tiết.
Luyện đọc hiểu theo từng passage & full test.

Luyện nghe theo từng Part & full test, chấm tự động theo đáp án.

Luyện nói Part 1/2/3 — chấm AI ngay, hoặc đặt lịch với Examiner VUS.
910 đề luyện tập
VUS IELTS Listening Test 199
LUYỆN TẬP NGAYListening
VUS IELTS Listening Test 87
LUYỆN TẬP NGAYspace and astronomy
Đề Reading: The Surprising Silence of the Universe
LUYỆN TẬP NGAYLine Graph
The graph below shows the average number of visitors per day to a city museum across six months in 2023, broken down by three visitor groups: local residents, domestic tourists, and international tour
LUYỆN TẬP NGAYListening
VUS IELTS Listening Test 105
LUYỆN TẬP NGAYtechnology and innovation
Đề Reading: How Electrochromic Glass Changes Colour on Demand
LUYỆN TẬP NGAYMap
The two maps below show how a small market town called Renwick changed between 2000 and 2022, reflecting shifts in household spending patterns and local economic activity. Summarise the information by
LUYỆN TẬP NGAYListening
VUS IELTS Listening Test 5
LUYỆN TẬP NGAYBar Chart
The chart below shows the percentage of people who owned a smartphone, broken down by income level, across four device types in 2023. Summarise the information by selecting and reporting the main feat
LUYỆN TẬP NGAYAdv. & Disadv.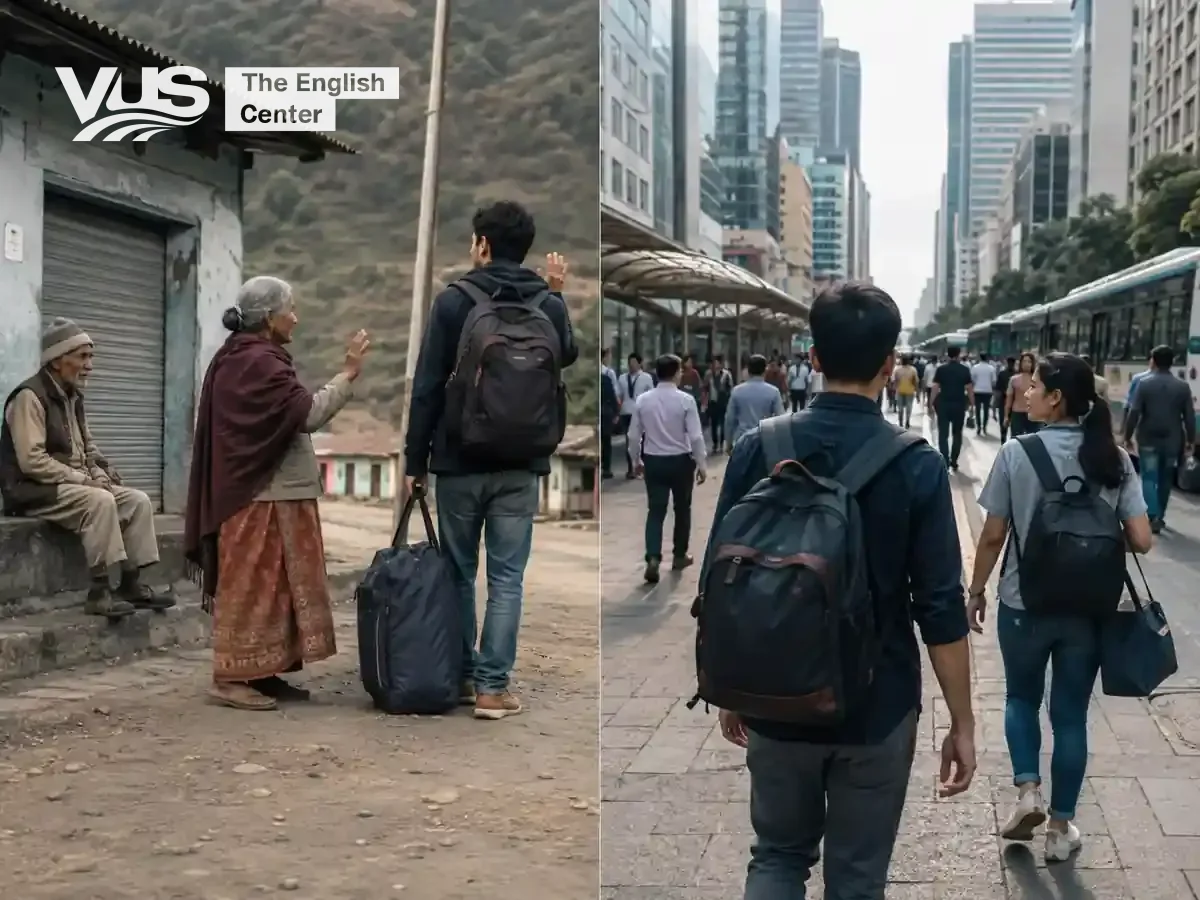
In many countries, young people from rural areas are moving to cities in search of better opportunities, leaving their villages with ageing populations and fewer services. Discuss the advantages and d
LUYỆN TẬP NGAYTwo-part
The pace at which new technologies are adopted differs greatly between developed and developing countries. Why does this technological gap exist between wealthier and poorer nations? What can developi
LUYỆN TẬP NGAYbusiness and economics
Đề Reading: How Dynamic Pricing Works
LUYỆN TẬP NGAYMixed Graph
The bar chart shows the average monthly household spending on non-essential goods and services in 2023, broken down by age group, while the line graph shows how total consumer spending on non-essentia
LUYỆN TẬP NGAYspace and astronomy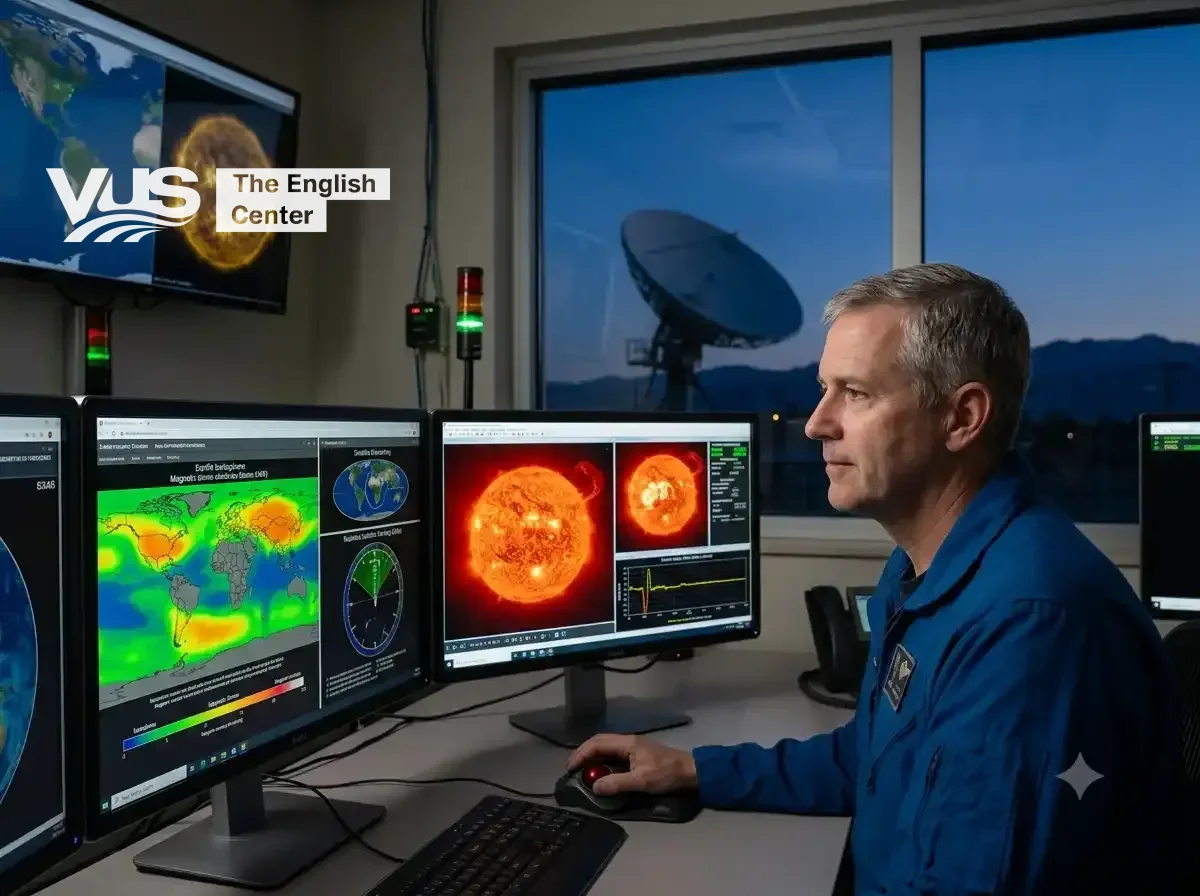
Đề Reading: Space Weather Forecasting: Promise and Reality
LUYỆN TẬP NGAYhistory and archaeology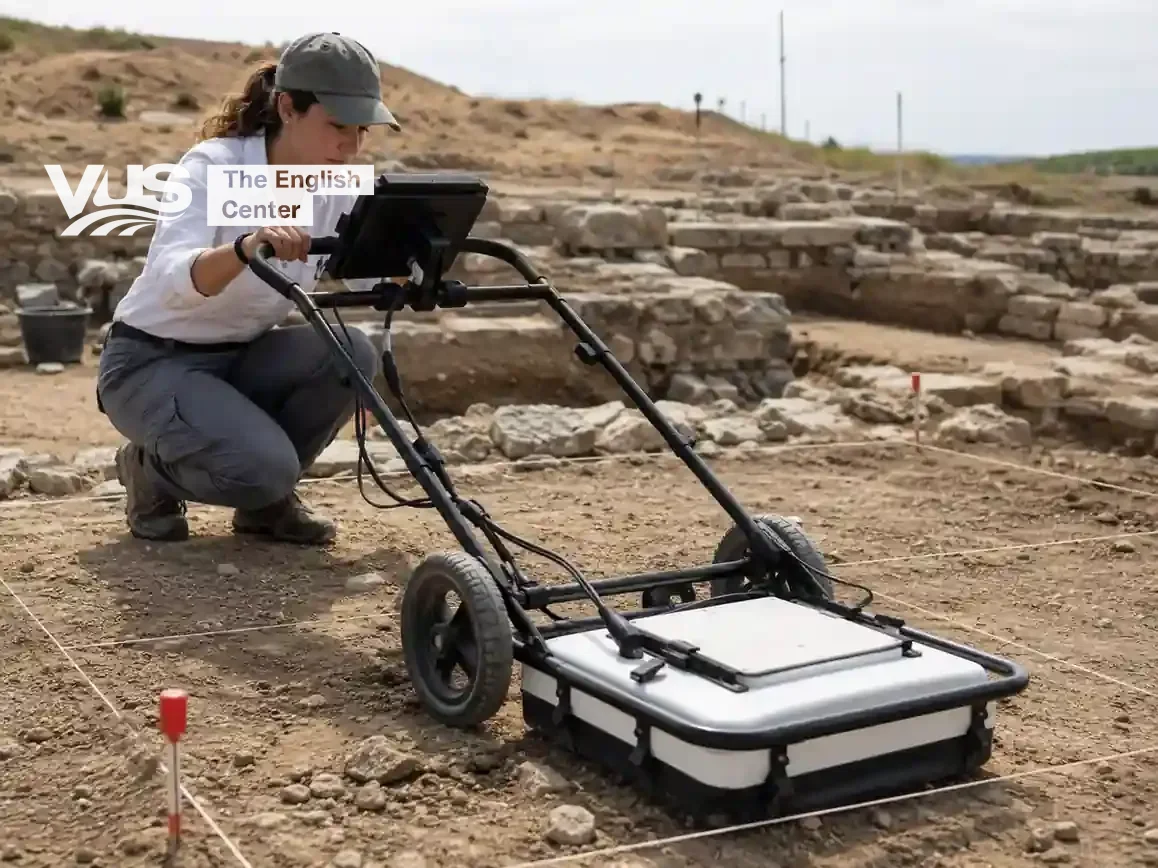
Đề Reading: Ground-Penetrating Radar in Archaeology: Promise and Reality
LUYỆN TẬP NGAYPie Chart
The two charts below show the breakdown of global internet traffic by content type in 2012 and 2023. Summarise the information by selecting and reporting the main features, and make comparisons where
LUYỆN TẬP NGAYfood and agriculture
Đề Reading: Many Ways to Feed the World: How Different Disciplines Study Food Security
LUYỆN TẬP NGAYListening
VUS IELTS Listening Test 30
LUYỆN TẬP NGAYBar Chart
The chart below shows the percentage of households with high-speed broadband access in five countries, broken down by three income groups, in 2023. Summarise the information by selecting and reporting
LUYỆN TẬP NGAYProcess
The diagram below illustrates the process by which a smart home energy management system might, in the future, automatically regulate household energy use across a typical family day. Summarise the in
LUYỆN TẬP NGAY