

Chọn kỹ năng và bắt đầu luyện tập - chấm điểm tự động theo chuẩn band IELTS.
Chấm điểm bài viết theo band IELTS với phản hồi chi tiết.
Luyện đọc hiểu theo từng passage & full test.

Luyện nghe theo từng Part & full test, chấm tự động theo đáp án.

Luyện nói Part 1/2/3 — chấm AI ngay, hoặc đặt lịch với Examiner VUS.
910 đề luyện tập

The charts show world pineapple exports by the top three pineapple-producing countries in 2009 and 2019, and a breakdown of the cost to the consumer of each pineapple in 2019. Summarise the informa
LUYỆN TẬP NGAYListening
VUS IELTS Listening Test 157
LUYỆN TẬP NGAYeducation and learning
Đề Reading: The Spacing Effect: How a 2019 Study Changed the Way Schools Think About Revision
LUYỆN TẬP NGAYBar Chart
The bar chart below shows the percentage of adults with a university-level qualification in four countries across three decades: 1990, 2005, and 2020. Summarise the information by selecting and report
LUYỆN TẬP NGAYBar Chart
The bar chart below shows the average annual per capita carbon dioxide emissions (in metric tonnes) from three sectors - transport, industry, and residential energy use - across five countries in 2021
LUYỆN TẬP NGAYLine Graph
The graph below shows the annual foreign direct investment (FDI) inflows, in billions of US dollars, into two contrasting economic regions - Sub-Saharan Africa and Southeast Asia - between 2005 and 20
LUYỆN TẬP NGAYListening
VUS IELTS Listening Test 57
LUYỆN TẬP NGAYListening
VUS IELTS Listening Test 109
LUYỆN TẬP NGAYDiscussion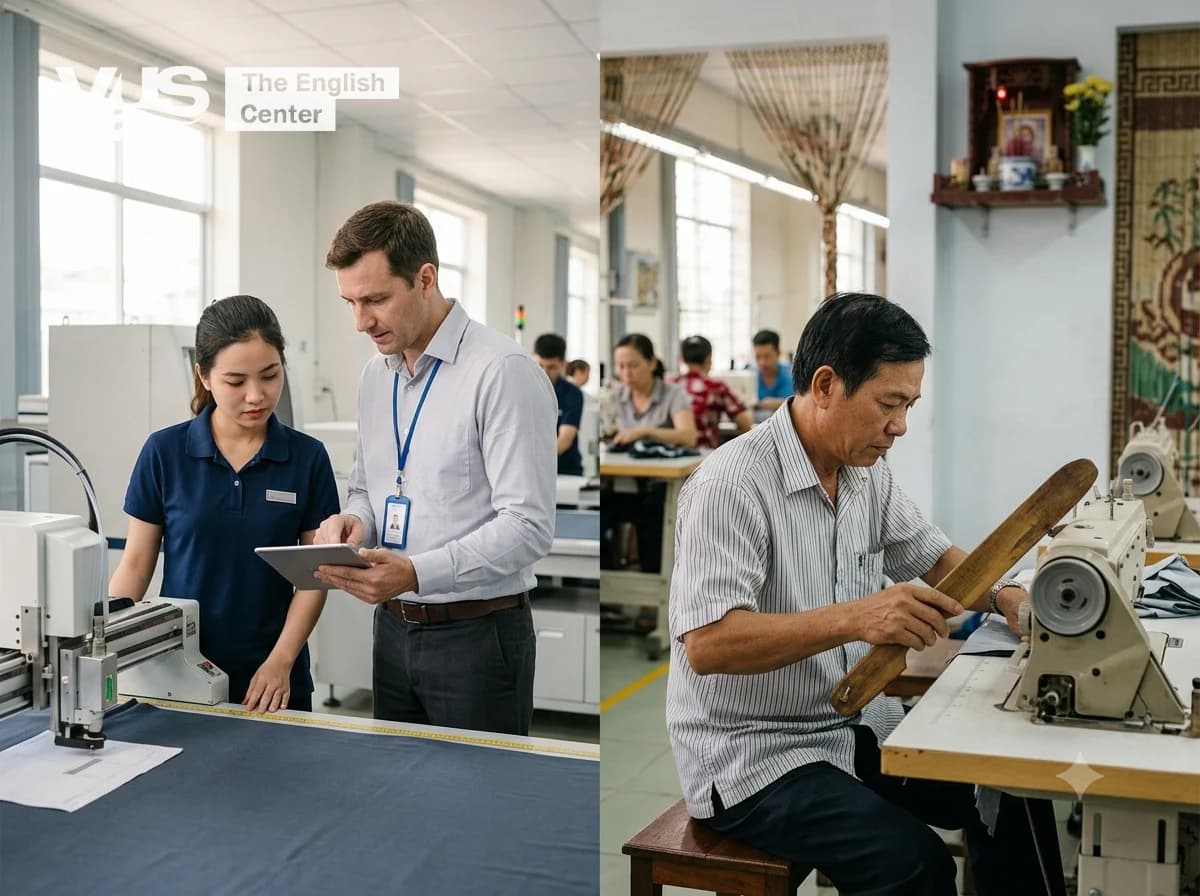
Some employers believe that adopting globally standardised workplace practices, such as international performance frameworks and uniform corporate culture, leads to greater efficiency and competitiven
LUYỆN TẬP NGAYReading
Reading IELTS, Passage 1, chủ đề Biology
LUYỆN TẬP NGAYMixed Graph
The bar chart shows the percentage of people in four age groups who participated in a community tree-planting programme in 2022, while the pie chart shows the breakdown of total trees planted by age g
LUYỆN TẬP NGAYListening
VUS IELTS Listening Test 159
LUYỆN TẬP NGAYMap
The two maps below show how an industrial estate on the outskirts of the city of Melbrook changed between 1985 and 2020. Summarise the information by selecting and reporting the main features, and mak
LUYỆN TẬP NGAYMixed Graph
The bar chart shows the average number of hours worked per week by full-time employees in Northern Europe and Southern Europe across four occupational sectors in 2022. The line graph shows the overall
LUYỆN TẬP NGAYTable
The table below shows the average weekly working hours, annual leave entitlement (in days), and job satisfaction score (out of 10) for full-time employees across four education levels in Australia in
LUYỆN TẬP NGAYBar Chart
The chart below shows the average monthly volume of cross-border freight shipments (in millions of tonnes) passing through four major global trade hubs across three seasons in 2023. Summarise the info
LUYỆN TẬP NGAYOpinion
Some people believe that governments are primarily responsible for reducing poverty, and that individuals should not be expected to take action to improve their own financial situation. To what extent
LUYỆN TẬP NGAYListening
VUS IELTS Listening Test 139
LUYỆN TẬP NGAYProblem-Solution
In many countries, multigenerational households - where grandparents, parents, and children once lived together - are rapidly disappearing, with younger generations increasingly choosing to live indep
LUYỆN TẬP NGAYProcess
The diagram below shows the process by which an online adaptive learning platform analyses student performance data and delivers personalised course content. Summarise the information by selecting and
LUYỆN TẬP NGAY